
Facebook开源一站式服务python时序利器Kats详解
这篇文章主要为答案及介绍了Facebook开源一站式服务python时序利器Kats的功能详解,有需要的朋友可以借鉴参考下,希望能够有所帮助,祝大家多多进步
目录
什么是 Kats?
安装 Kats
将数据转换为时间序列
预测
从使用 Prophet 进行预测开始:
可视化
Holt-Winters
检测变化点
机器学习
深度学习
孤立点检测
时间序列特征
小结
转自微信公众号:机器学习社区,经作者授权转载
时间序列分析是数据科学中一个非常重要的领域,它主要包含统计分析、检测变化点、异常检测和预测未来趋势。然而,这些时间序列技术通常由不同的库实现。有没有一种方法可以让你在一个库中获得所有这些技术?
答案是肯定的,本文中我将分享一个非常棒的工具包 Kats,它可以完美解决上述问题。
什么是 Kats?
目前时间序列分析以及建模的技术非常多,但相对散乱,本次 FaceBook 开源了 Kats,它是一款轻量级的、易于使用的、通用的时间序列分析框架,包括:预测、异常检测、多元分析和特征提取嵌入。你可以将 Kats 视为 Python 中时间序列分析的一站式工具包。
安装 Kats
1 2 | pip install --upgrade pippip install kats |
为了了解 Kats 的功能,我们将使用这个框架来分析 Kaggle 上的 StackOverflow问题计数问题。数据链接为:https://www.kaggle.com/aishu200023/stackindex
首先我们从读取数据开始。
1 2 3 4 5 | import pandas as pddf = pd.read_csv("MLTollsStackOverflow.csv")# Turn the month column into datetimedf["month"] = pd.to_datetime(df["month"], format="%y-%b")df = df.set_index("month") |
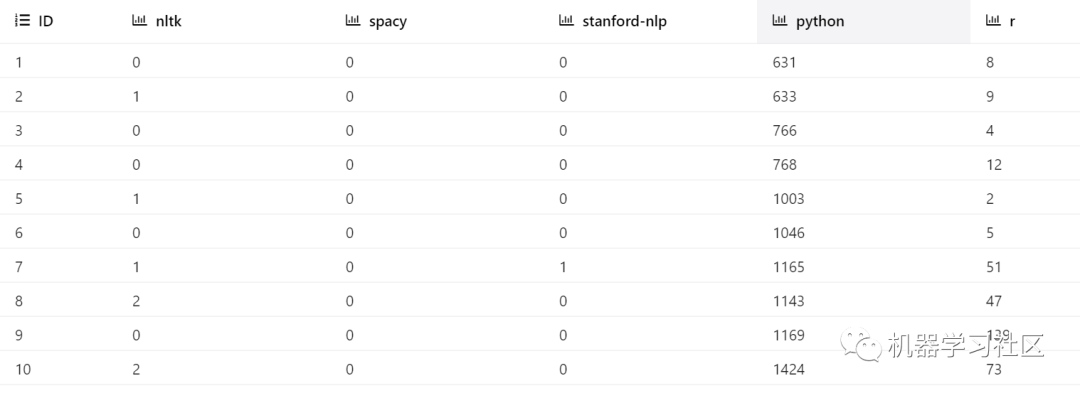
现在让我们分析一下与 Python 相关的 StackOverflow 问题计数。数据被分成一列和一个测试集来评估预测。
1 2 3 4 5 6 | python = df["python"].to_frame()# Split data into train and test settrain_len = 102train = python.iloc[:train_len]test = python.iloc[train_len:] |
将数据转换为时间序列
首先构造一个时间序列对象。我们使用time_col_name='month'指定时间列。
1 2 3 4 | from kats.consts import TimeSeriesData# Construct TimeSeriesData objectts = TimeSeriesData(train.reset_index(), time_col_name="month") |
要绘制数据,调用plot方法:
1 | ts.plot(cols=["python"]) |
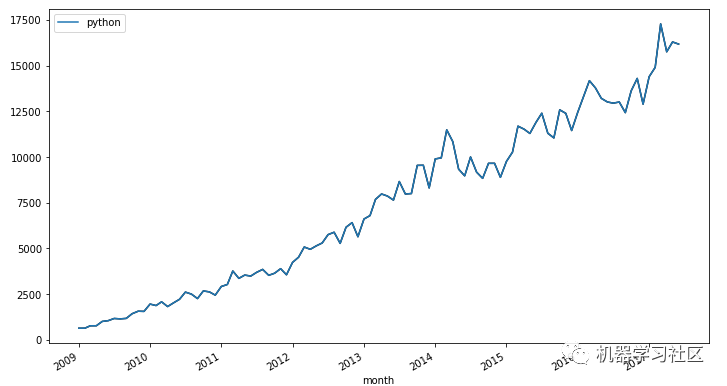
酷!看起来关于 Python 的问题的数量随着时间的推移而增加。我们能预测未来30天的趋势吗?是的,我们可以和 Kats 一起做。
预测
Kats目前支持以下10种预测模型:
Linear
Quadratic
ARIMA
SARIMA
Holt-Winters
Prophet
AR-Net
LSTM
Theta
VAR
上述模型较多,让我们试一下其中两种类型吧!
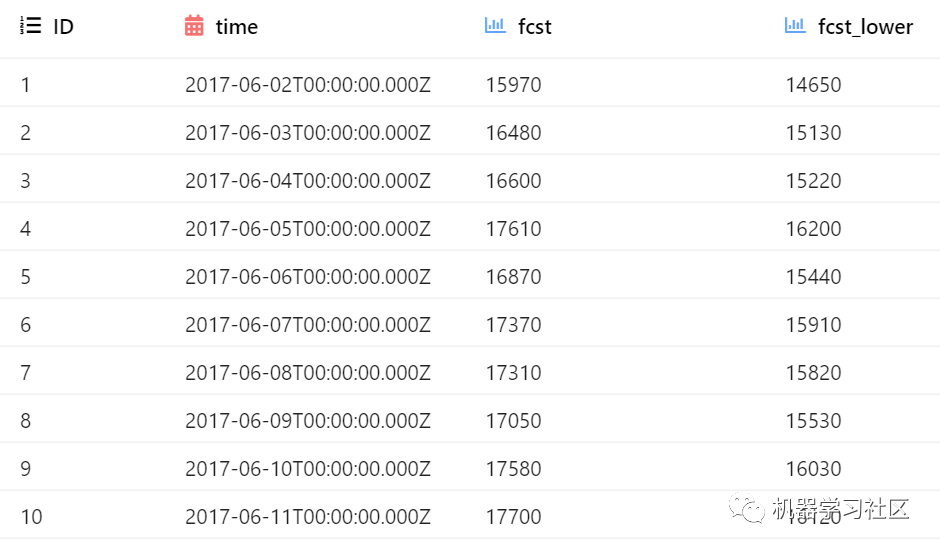
从使用 Prophet 进行预测开始:
1 2 3 4 5 6 7 8 9 10 | from kats.models.prophet import ProphetModel, ProphetParams# Specify parametersparams = ProphetParams(seasonality_mode="multiplicative")# Create a model instancem = ProphetModel(ts, params)# Fit modem.fit()# Forecastfcst = m.predict(steps=30, freq="MS")fcst |
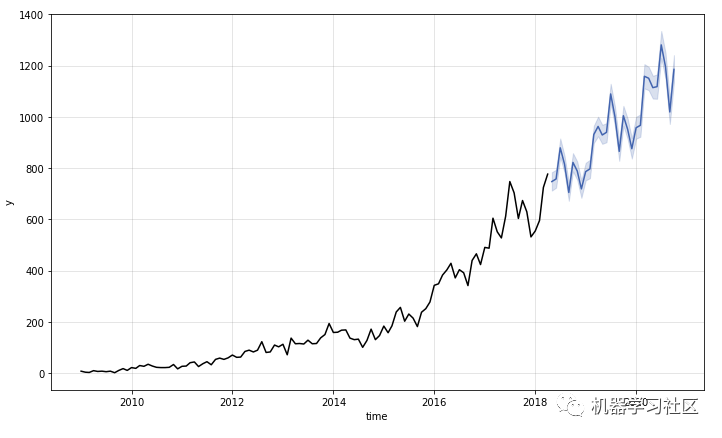
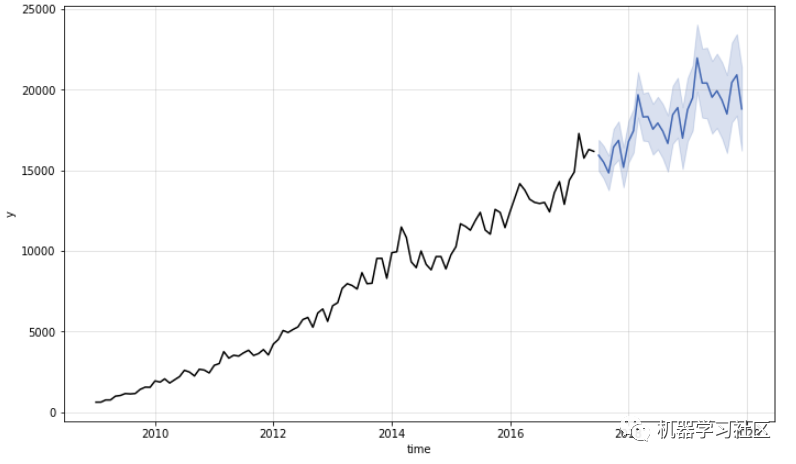
可视化
1 | m.plot() |

酷!让我们通过与测试数据的比较来评估预测。
1 2 3 4 5 6 7 | import matplotlib.pyplot as pltfig, ax = plt.subplots(figsize=(12, 7))train.plot(ax=ax, label="train", color="black")test.plot(ax=ax, color="black")fcst.plot(x="time", y="fcst", ax=ax, color="blue")ax.fill_between(test.index, fcst["fcst_lower"], fcst["fcst_upper"], alpha=0.5)ax.get_legend().remove() |
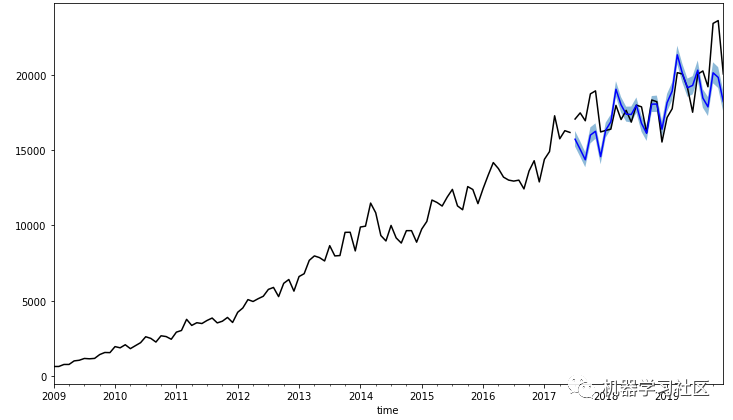
预报似乎很好地符合观察结果!
Holt-Winters
我们将尝试的下一个模式是Holt-Winters。它是一种捕捉季节性的方法。下面是如何在 Kats 中使用 Holt-Winters 方法。
1 2 3 4 5 6 7 8 9 10 11 12 13 14 | from kats.models.holtwinters import HoltWintersParams, HoltWintersModelimport warningswarnings.simplefilter(action='ignore')params = HoltWintersParams( trend="add", seasonal="mul", seasonal_periods=12, )m = HoltWintersModel( data=ts, params=params)m.fit()fcst = m.predict(steps=30, alpha = 0.1)m.plot() |
检测变化点
你有没有想过在你的时间序列中发生统计上显著的均值变化的时间?
Kats 允许使用 CUSUM 算法检测变化点。Cusum 是一种检测时间序列中均值上下移动的方法。
让我们看看如何检测 Kats 中的变化点。
1 2 3 4 5 6 7 8 9 10 | from kats.consts import TimeSeriesData, TimeSeriesIteratorfrom kats.detectors.cusum_detection import CUSUMDetectorimport matplotlib.pyplot as pltdetector = CUSUMDetector(ts)change_points = detector.detector(change_directions=["increase", "decrease"])print("The change point is on", change_points[0][0].start_time)# plot the resultsplt.xticks(rotation=45)detector.plot(change_points)plt.show() |
酷!让我们尝试检测 StackOverflow 问题计数的其他类别的变化点。
首先创建一个函数来检测主题提供的更改点。
1 2 3 4 5 6 7 8 9 10 11 12 13 14 15 | def get_ts(topic: str): return TimeSeriesData(df[topic].to_frame().reset_index(), time_col_name="month")def detect_change_point(topic: str): ts = get_ts(topic) detector = CUSUMDetector(ts) change_points = detector.detector() for change_point in change_points: print("The change point is on", change_point[0].start_time) # plot the results plt.xticks(rotation=45) detector.plot(change_points) plt.show() |
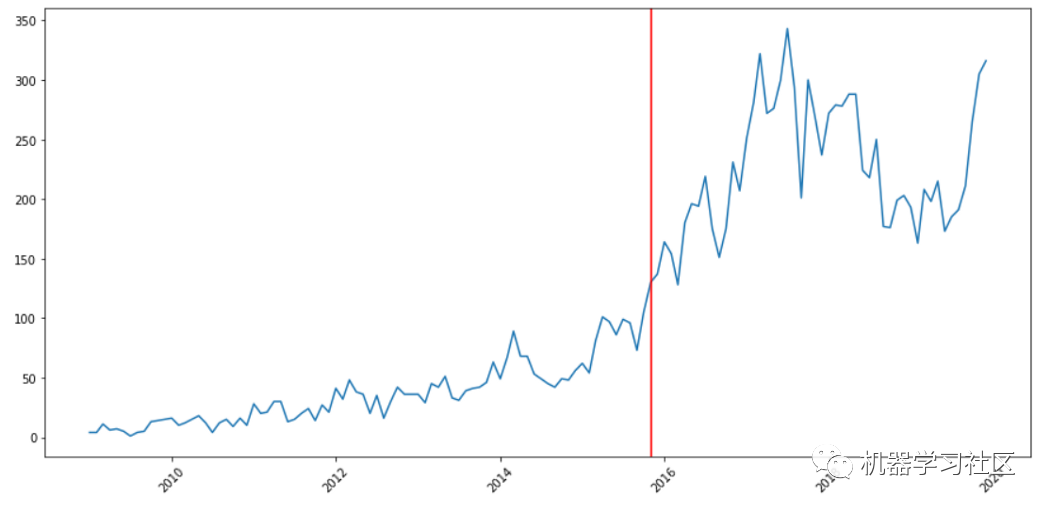
机器学习
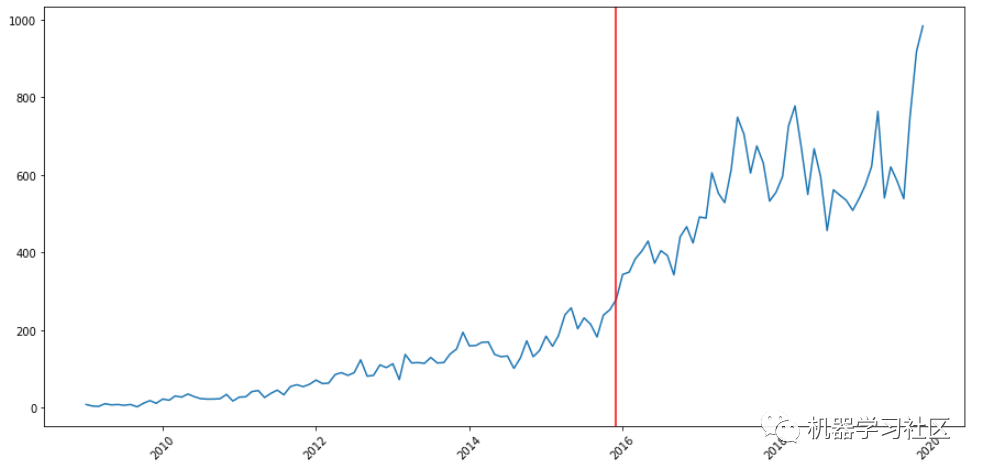
1 | detect_change_point("machine-learning") |
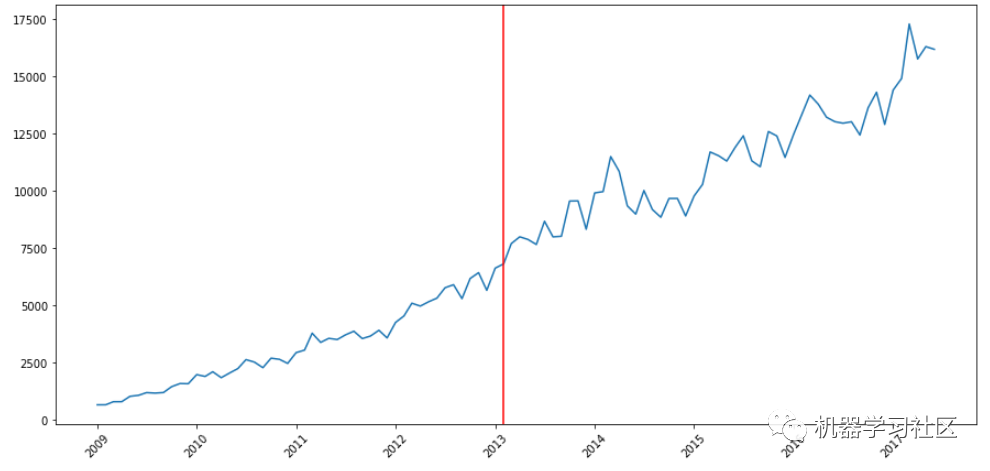
深度学习
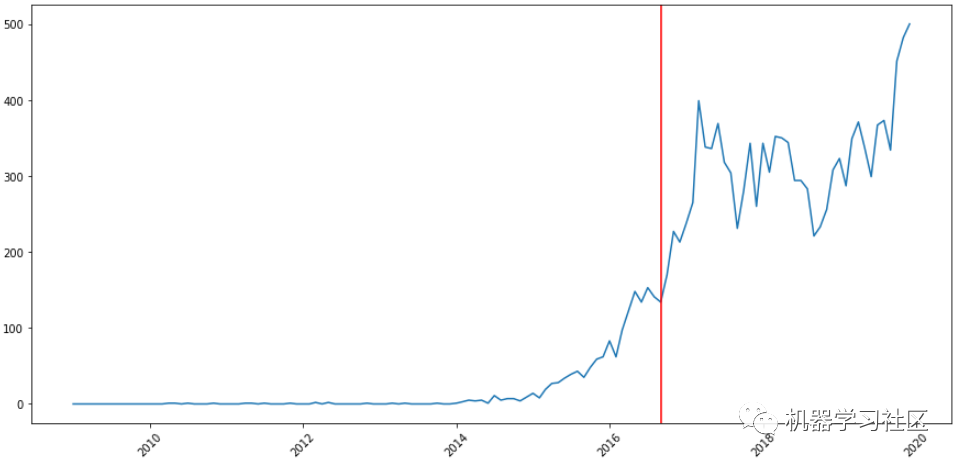
1 | detect_change_point("deep-learning") |
孤立点检测
你在看NLP的时间序列时看到了什么?
1 | df["nlp"].plot() |
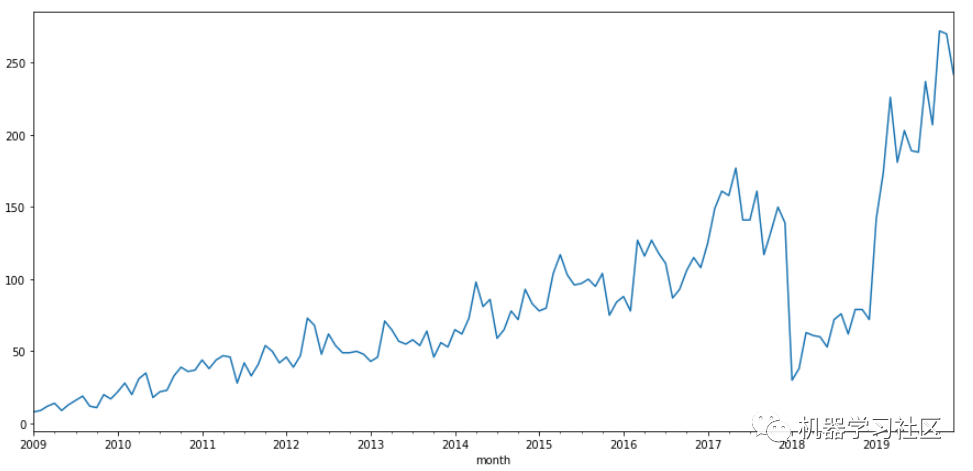
从2018年到2019年,NLP的问题数量有所下降。
问题数量的下降是一个异常值。检测异常值很重要,因为它们可能会在下游处理中造成问题。
然而,通过查看数据来发现异常值并不总是高效和容易的。幸运的是,Kats还允许您检测时间序列中的异常值!
用kat检测异常值只需要几行行代码。
1 2 3 4 5 6 7 8 9 10 11 12 | from kats.detectors.outlier import OutlierDetector# Get time series objectts = get_ts("nlp")# Detect outliersts_outlierDetection = OutlierDetector(ts, "additive")ts_outlierDetection.detector()# Print outliersoutlier_range1 = ts_outlierDetection.outliers[0]print(f"The outliers range from {outlier_range1[0]} to {outlier_range1[1]}") |
The outliers range from 2018-01-01 00:00:00 to 2019-03-01 00:00:00
酷!结果证实了我们从上图中看到的情况。
时间序列特征
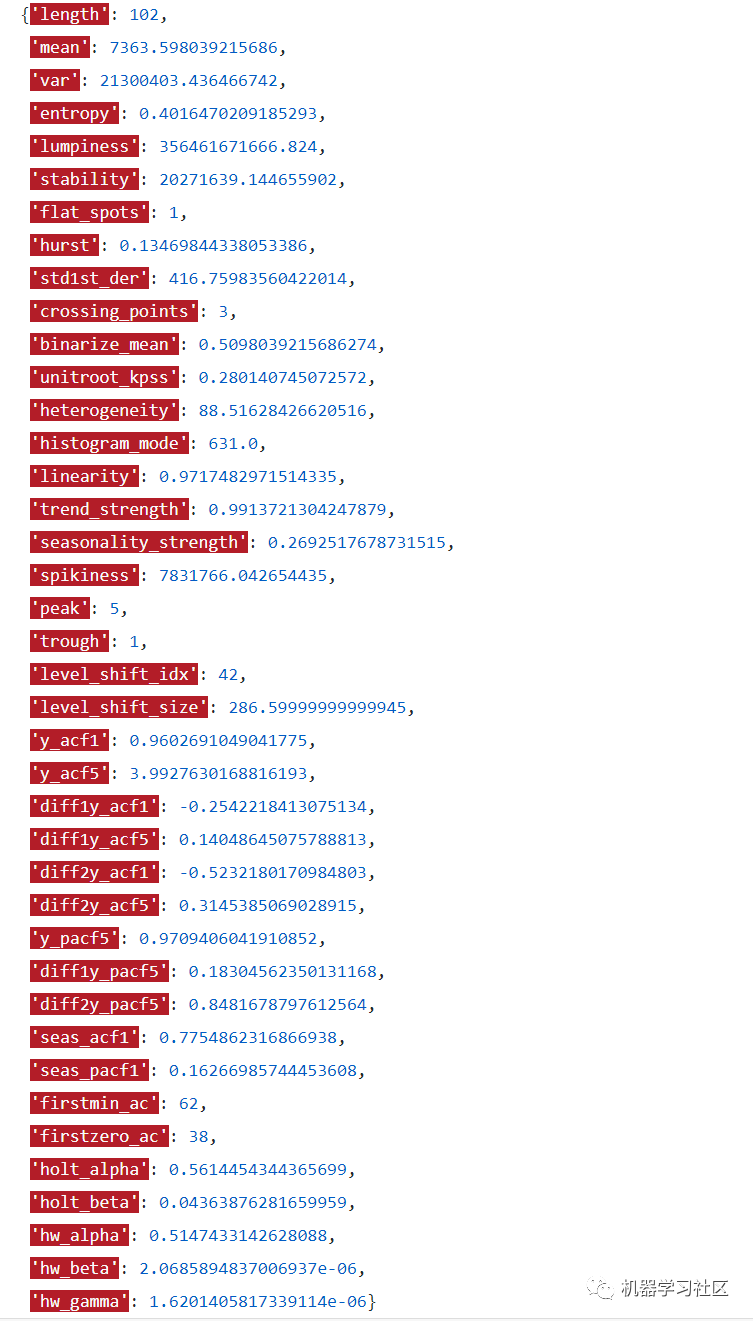
除了统计数据外,时间序列中还有其他一些特性,如线性、趋势强度、季节性强度、季节性参数等,您可能会感兴趣。
Kats 允许通过 TsFeatures 查找有关时间序列特征的重要信息:
1 2 3 4 5 6 | from kats.tsfeatures.tsfeatures import TsFeaturesmodel = TsFeatures()output_features = model.transform(ts)output_features |
小结
我们刚刚学习了如何使用 Kats 来预测、检测变化点、检测异常值和提取时间序列特征。我希望这篇文章能帮助到大家解决工作中的时间序列问题,并从数据中提取有价值的信息。
以上就是Facebook开源一站式服务python时序利器Kats详解的详细内容
原文链接:https://blog.csdn.net/weixin_38037405/article/details/120122477