
结构方程和路径分析,心理地基


路径分析(Path analysis)是一种研究多个变量之间因果关系及其强度的统计方法。由美国遗传学家S.赖特于1921年首创。路径分析的主要目的是检验一个假想的因果模型的准确和可靠程度,测量变量间因果关系的强弱。常用软件:Lisrel,Mplus。
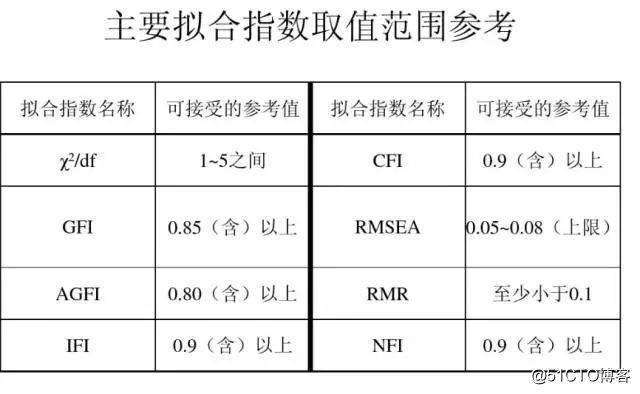
路径分析主要步骤:选择变量和建立因果关系模型>检验假设>估计参数>评估因果模型(根据模型拟合指标进行判断,如卡方值是否限制,GFI,RMSE等)路径分析结果解释:路径系数,经过标准化的估计值,单向箭头上的数字表示路径系数,即标准化回归系数。单向箭头由自变量指向因变量,其路径系数值表示了自变量对因变量的直接效应的方向和大小。
路径分析的主要目的是检验一个假想的因果模型的准确和可靠程度,测量变量间因果关系的强弱,回答下述问题:①模型中两变量xj与xi间是否存在相关关系;②若存在相关关系,则进一步研究两者间是否有因果关系;③若xj影响xi,那么xj是直接影响xi,还是通过中介变量间接影响或两种情况都有;④直接影响与间接影响两者大小如何。
路径分析的主要步骤:
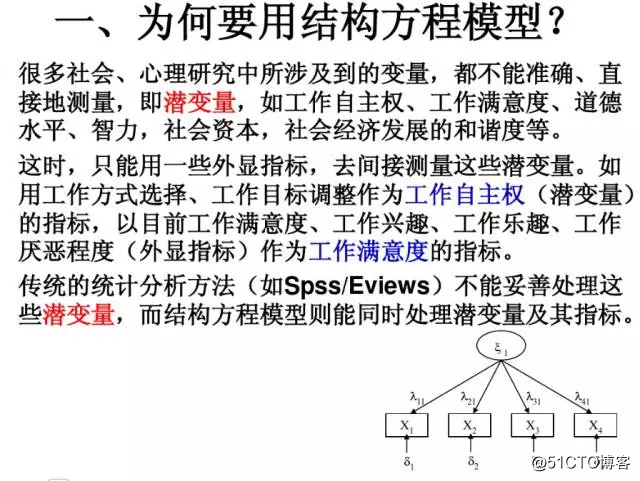
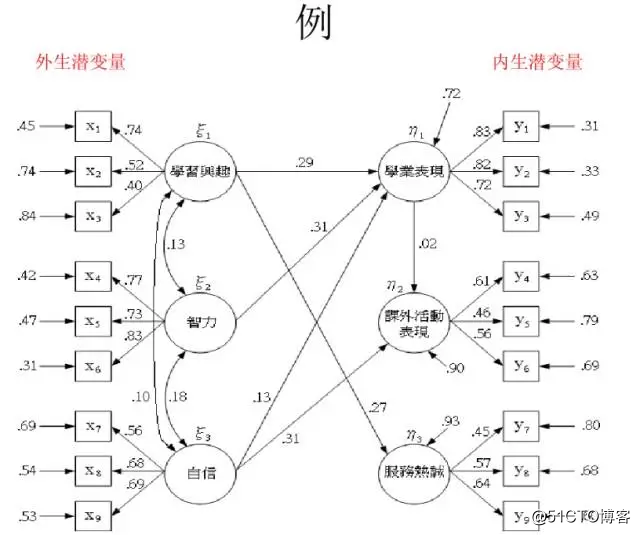
①选择变量和建立因果关系模型。这是路径分析的前提。研究人员多用路径图形象地将变量的层次,变量间因果关系的路径、类型、结构等,表述为所建立的因果模型。下图是5个变量因果关系的路径。
图中带箭头的直线“→”连接的是具有因果关系的两个变量,箭头的方向与因果的方向相同;当两变量只有相关关系而无因果关系时,用弧线双向箭头表示。图中变量分为:a.外生变量。因果模型中只扮演因,从不扮演果的变量,是不受模型中其他变量影响的独立变量,如x1与 x2。b.内生变量。模型中既可为因又可为果的变量,其变化受模型中其他变量的影响,如x3、x4与x5。c.残差变量。来自因果模型之外的影响因变量的所有变量的总称,如e3、e4、e5。
若变量间的关系是线性可加的,则图中的因果模型可用3个标准化多元线性回归方程表示:。pij 称为由xj到xi的路径系数,它表示xj与xi间因果关系的强弱,即当其他变量均保持不变时,变量xj对变量xi的直接作用力的大小。pie称为残差路径系数,它表示所有自变量所不能解释的因变量的变异部分,其大小对于因果模型的确定有重要作用。
②检验假设。路径分析要以下列假定为前提:a.变量间的因果关系是单向的,不具有反馈性,又称递归模型;b.变量间具有线性可加关系;c.变量具有等距以上测量尺度;d.所有误差均为随机的,外生变量无测量误差;e.所有内生变量的误差变量间及与内生变量有因果关系的所有自变量间无相关。当某些假定,如递归性或变量的测量尺度不满足时,要做适当的处理才能应用路径分析。
③估计参数。首先计算路径系数与残差路径系数,然后计算两变量间相关系数rji。此外,要计算两变量间总因果作用力,包括变量xj对xi的直接作用力、xj经中间变量而对xi的间接作用力两部分。例如,上图的因果模型中,x1对x5的总作用力由直接作用力p51和间接作用力构成。这两部分作用力的大小可由两变量间的相关系数rij的分解得到。最后还要计算决定系数嵀,它表示所有作用于xi的自变量所能解释xi变异量的比例。
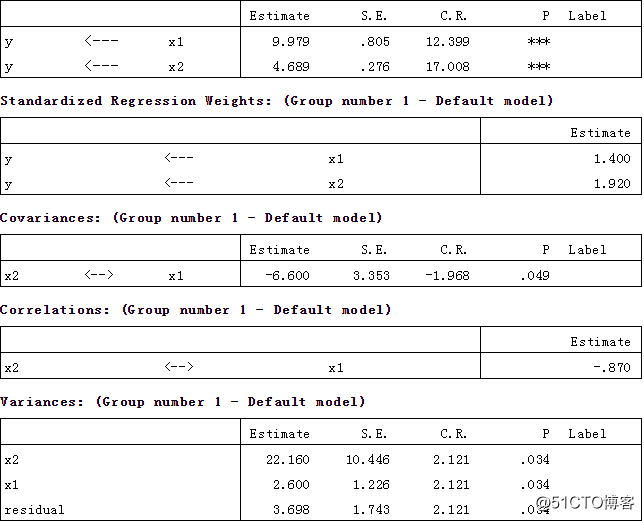
Scalar Estimates (Group number 1 - Default model)
Maximum Likelihood Estimates
Regression Weights: (Group number 1 - Default model)

Path analysis is a straightforward extension of multiple regression. Its aim is to provide estimates of the magnitude and significance of hypothesised causal connections between sets of variables. This is best explained by considering a path diagram.
To construct a path diagram we simply write the names of the variables and draw an arrow from each variable to any other variable we believe that it affects. We can distinguish between input and output path diagrams. An input path diagram is one that is drawn beforehand to help plan the analysis and represents the causal connections that are predicted by our hypothesis. An output path diagram represents the results of a statistical analysis, and shows what was actually found.
So we might have an input path diagram like this:
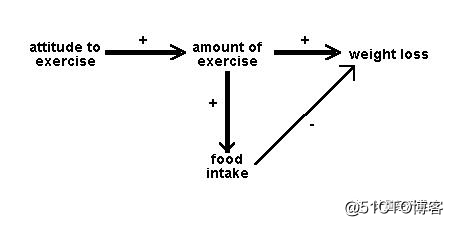
Figure 1: Idealised input path diagram
And an output path diagram like this:
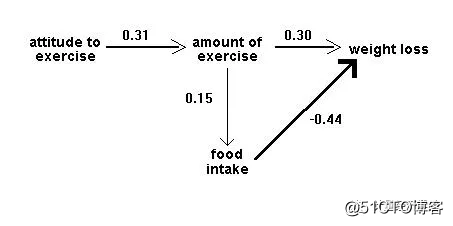
Figure 2: Idealised output path diagram
It is helpful to draw the arrows so that their widths are proportional to the (hypothetical or actual) size of the path coefficients. Sometimes it is helpful to eliminate negative relationships by reflecting variables - e.g. instead of drawing a negative relationship between age and liberalism drawing a positive relationship between age and conservatism. Sometimes we do not want to specify the causal direction between two variables: in this case we use a double-headed arrow. Sometimes, paths whose coefficients fall below some absolute magnitude or which do not reach some significance level, are omitted in the output path diagram.
Some researchers will add an additional arrow pointing in to each node of the path diagram which is being taken as a dependent variable, to signify the unexplained variance - the variation in that variable that is due to factors not included in the analysis.
Path diagrams can be much more complex than these simple examples: for a virtuoso case, see Wahlund (1992, Fig 1).
Although path analysis has become very popular, we should bear in mind a cautionary note from Everitt and Dunn (1991): "However convincing, respectable and reasonable a path diagram... may appear, any causal inferences extracted are rarely more than a form of statistical fantasy". Basically, correlational data are still correlational. Within a given path diagram, patha analysis can tell us which are the more important (and significant) paths, and this may have implications for the plausibility of pre-specified causal hypotheses. But path analysis cannot tell us which of two distinct path diagrams is to be preferred, nor can it tell us whether the correlation between A and B represents a causal effect of A on B, a causal effect of B on A, mutual dependence on other variables C, D etc, or some mixture of these. No program can take into account variables that are not included in an analysis.
What, then, can a path analysis do? Most obviously, if two or more pre-specified causal hypotheses can be represented within a single input path diagram, the relative sizes of path coefficients in the output path diagram may tell us which of them is better supported by the data. For example, in Figure 4 below, the hypothesis that age affects job satisfaction indirectly, via its effects on income and working autonomy, is preferred over the hypothesis that age has a direct effect on job satisfaction. Slightly more subtly, if two or more pre-specified causal hypotheses are represented in different input path diagrams, and the corresponding output diagrams differ in complexity (so that in one there are many paths with moderate coefficients, while in another there are just a few paths with large, significant coefficients and all other paths have negligible coefficients), we might prefer the hypothesis that yielded the simpler diagram. Note that this latter argument would not really be statistical, though the statistical work is necessary to give us the basis from which to make it.
Path analysis in practice
Bryman and Cramer give a clear example using four variables from a job survey: age, income, autonomy and job satisfaction. They propose that age has a direct effect on job satisfaction. However indirect effects of age on job satisfaction are also suggested; age affects income which in turn affects satisfaction, age affects autonomy which in turn affects satisfaction and age affects autonomy which affects income which affects satisfaction. Autonomy and income have direct affects on satisfaction.
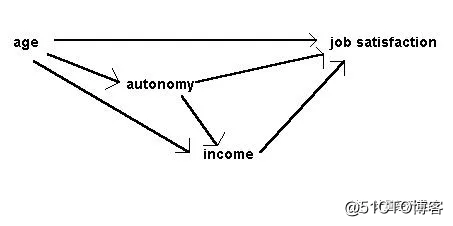
Figure 3: Input diagram of causal relationships in the job survey, after Bryman & Cramer (1990)
To move from this input diagram to the output diagram, we need to compute path coefficients. A path coefficient is a standardized regression coefficient (beta weight). We compute these by setting up structural equations, in this case:
satisfaction = b11age + b12autonomy + b13 income + e1
income = b21age + b22autonomy + e2
autonomy = b31age + e3
We have used a different notation for the coefficients from Bryman and Cramer's, to make it clear that b11 in the first equation is different from b21 in the second. The terms e1, e2, and e3 are the error or unexplained variance terms. To obtain the path coefficients we simply run three regression analyses, with satisfaction, income and autonomy being the dependent variable in turn and using the independent variables specified in the equations. Because we need beta values, if we are using Minitab we must first standardise the variables (subtract each column from its mean and divide by its standard deviation); SPSS will give us beta values without this preliminary step. In Bryman and Cramer's example, we find that b11=-0.08, b12=0.58, b12=0.47, b21=0.57, b22=0.22, and b31=0.28. In either case, the betas are then taken from the output and then inserted into the output path diagram. The constant values (a1, a2, and a3) are not used. So the complete output path diagram looks like this:
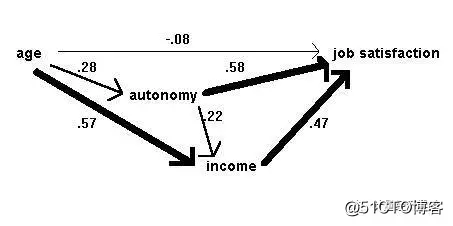
Figure 4: Output diagram of causal relationships in the job survey, after Bryman & Cramer (1990)
If the values of e1, e2, and e3 are required, they are calculated as the square root of 1-R2 (note not 1-R2adj) from the regression equation for the corresponding dependent variable.
Many researchers like to calculate the overall impact of one variable on another - e.g. of age on job satisfaction. This is done by simply adding the direct effect of age (-0.08) and adding the indirect effects to it. The indirect effects are calculated by multiplying the coefficients for each path from age to satisfaction e.g.
age -> income -> satisfaction is 0.57 x 0.47 = 0.26,
age -> autonomy -> satisfaction is 0.28 x 0.58 = 0.16,
age -> autonomy -> income -> satisfaction is 0.28 x 0.22 x 0.47 = 0.03
total indirect effect = 0.45
The result tells us that the total indirect effect of age on satisfaction is positive and quite large whereas the direct effect is small and negative. The total effect is then -0.08 + 0.45 = 0.37.
Limitations of path analysis
To restate the obvious, path analysis can evaluate causal hypotheses, and in some (restricted) situations can test between two or more causal hypotheses, but it cannot establish the direction of causality.
As should also already be clear, path analysis is most likely to be useful when we already have a clear hypothesis to test, or a small number of hypotheses all of which can be represented within a single path diagram. It has little use at the exploratory stage of research.
We cannot use path analysis in situations where "feedback" loops are included in our hypotheses: there must be a steady causal progression across (or down) a path diagram.
All the relationships in the path diagram must be capable of being tested by straightforward multiple regression. The intervening variables all have to serve as dependent variables in multiple regression analyses. Therefore each of them must be capable of being treated as being on an interval scale. Nominal measurement, or ordinal measurement with few categories (including dichotomies) will make path analysis impossible. Although there are types of analysis that will handle such dependent variables (as we shall see in the next two sessions), there are no accepted ways of mixing different kinds of analysis to produce the analogue of a path analysis.
Further reading:
Bryman, A. & Cramer, D. (1990). Quantitative data analysis for social scientists, pp. 246-251.
©著作权归作者所有:来自51CTO博客作者mb5fd86dae5fbf6的原创作品,如需转载,请注明出处,否则将追究法律责任