
matplotlib之pyplot模块坐标轴标签设置使用(xlabel()、ylabel())
这篇文章主要介绍了matplotlib之pyplot模块坐标轴标签设置使用(xlabel()、ylabel()),文中通过示例代码介绍的非常详细,对大家的学习或者工作具有一定的参考学习价值,需要的朋友们下面随着小编来一起学习学习吧
在pyplot模块中可以使用xlabel()和ylabel()函数设置x轴y轴的标签。这两个函数的使用方法非常相似。
使用xlabel()设置x轴标签
函数签名为matplotlib.pyplot.xlabel(xlabel, fontdict=None, labelpad=None, *, loc=None, **kwargs)
参数作用及取值如下:
xlabel:类型为字符串,即标签的文本。labelpad:类型为浮点数,默认值为None,即标签与坐标轴的距离。loc:取值范围为{'left', 'center', 'right'},默认值为rcParams["xaxis.labellocation"]('center'),即标签的位置。**kwargs:Text对象关键字属性,用于控制文本的外观属性,如字体、文本颜色等。
返回值为Text对象。
xlabel()相关rcParams为:
1 2 3 4 5 | #axes.labelsize: medium # fontsize of the x any y labels#axes.labelpad: 4.0 # space between label and axis#axes.labelweight: normal # weight of the x and y labels#axes.labelcolor: black#xaxis.labellocation: center # alignment of the xaxis label: {left, right, center} |
底层相关函数为:Axes.set_xlabel(xlabel, fontdict=None, labelpad=None, *, loc=None, **kwargs)Axes.get_xlabel()
案例
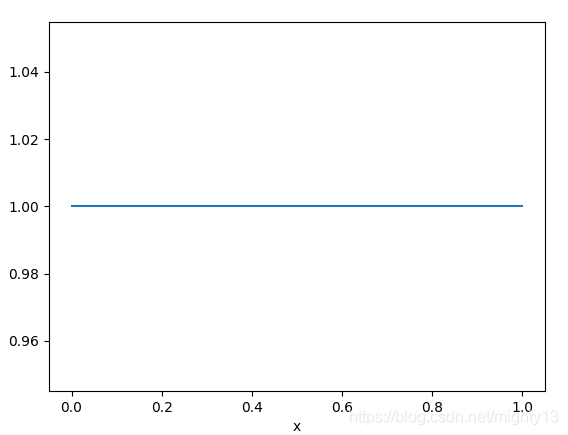
设置x轴标签,并输出xlabel函数的返回值。
返回值为Text对象,输出返回值的属性可知,标签文本的属性为_text。如果想获取标签文本,可使用Axes.get_xlabel方法获取。
1 2 3 4 5 6 7 8 9 | import matplotlib.pyplot as pltplt.plot([1, 1])a = plt.xlabel("x")print(a)print(vars(a))print(a._text)print(plt.gca().get_xlabel())plt.show() |
输出:
1 2 3 4 | Text(0.5, 0, 'x'){'_stale': True, 'stale_callback': None, '_axes': None, 'figure': <Figure size 640x480 with 1 Axes>, '_transform': <matplotlib.transforms.BlendedAffine2D object at 0x0000019EC1471F98>, '_transformSet': True, '_visible': True, '_animated': False, '_alpha': None, 'clipbox': None, '_clippath': None, '_clipon': True, '_label': '', '_picker': None, '_contains': None, '_rasterized': None, '_agg_filter': None, '_mouseover': False, 'eventson': False, '_oid': 0, '_propobservers': {}, '_remove_method': None, '_url': None, '_gid': None, '_snap': None, '_sketch': None, '_path_effects': [], '_sticky_edges': _XYPair(x=[], y=[]), '_in_layout': True, '_x': 0.5, '_y': 0, '_text': 'x', '_color': 'black', '_fontproperties': <matplotlib.font_manager.FontProperties object at 0x0000019EC1471BE0>, '_usetex': False, '_wrap': False, '_verticalalignment': 'top', '_horizontalalignment': 'center', '_multialignment': None, '_rotation': None, '_bbox_patch': None, '_renderer': None, '_linespacing': 1.2, '_rotation_mode': None}xx |
使用ylabel()设置y轴标签
函数签名为matplotlib.pyplot.ylabel(ylabel, fontdict=None, labelpad=None, *, loc=None, **kwargs)
参数作用及取值如下:
ylabel:类型为字符串,即标签的文本。labelpad:类型为浮点数,默认值为None,即标签与坐标轴的距离。loc:取值范围为{'bottom', 'center', 'top'},默认值为rcParams["yaxis.labellocation"]('center'),即标签的位置。**kwargs:Text对象关键字属性,用于控制文本的外观属性,如字体、文本颜色等。
返回值为Text对象。
xlabel()相关rcParams为:
1 2 3 4 5 | #axes.labelsize: medium # fontsize of the x any y labels#axes.labelpad: 4.0 # space between label and axis#axes.labelweight: normal # weight of the x and y labels#axes.labelcolor: black#yaxis.labellocation: center # alignment of the yaxis label: {bottom, top, center} |
底层相关函数为:Axes.set_ylabel(ylabel, fontdict=None, labelpad=None, *, loc=None, **kwargs)Axes.get_ylabel()
案例
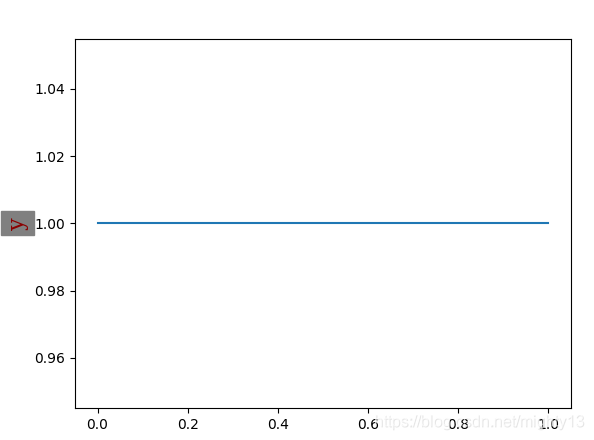
添加y轴标签,并设置字体属性和背景色。
1 2 3 4 5 6 7 8 9 10 11 | import matplotlib.pyplot as pltfont = {'family': 'serif', 'color': 'darkred', 'weight': 'normal', 'size': 16, }plt.plot([1, 1])plt.ylabel("y", fontdict=font, backgroundcolor='grey')plt.show() |
到此这篇关于matplotlib之pyplot模块坐标轴标签设置使用(xlabel()、ylabel())的文章就介绍到这了