
matplotlib grid()设置网格线外观的实现
这篇文章主要介绍了matplotlib grid()设置网格线外观的实现,文中通过示例代码介绍的非常详细,对大家的学习或者工作具有一定的参考学习价值,需要的朋友们下面随着小编来一起学习学习吧
grid()函数概述
grid()函数用于设置绘图区网格线。grid()的函数签名为matplotlib.pyplot.grid(b=None, which='major', axis='both', **kwargs)。grid()的参数如下:
b:是否显示网格线。布尔值或None,可选参数。如果没有关键字参数,则b为True,如果b为None且没有关键字参数,相当于切换网格线的可见性。which:网格线显示的尺度。字符串,可选参数,取值范围为{'major', 'minor', 'both'},默认为'both'。'major'为主刻度、'minor'为次刻度。axis:选择网格线显示的轴。字符串,可选参数,取值范围为{'both', 'x', 'y'},默认为'both'`。**kwargs:Line2D线条对象属性。
grid()的返回值为None。
grid()函数演示
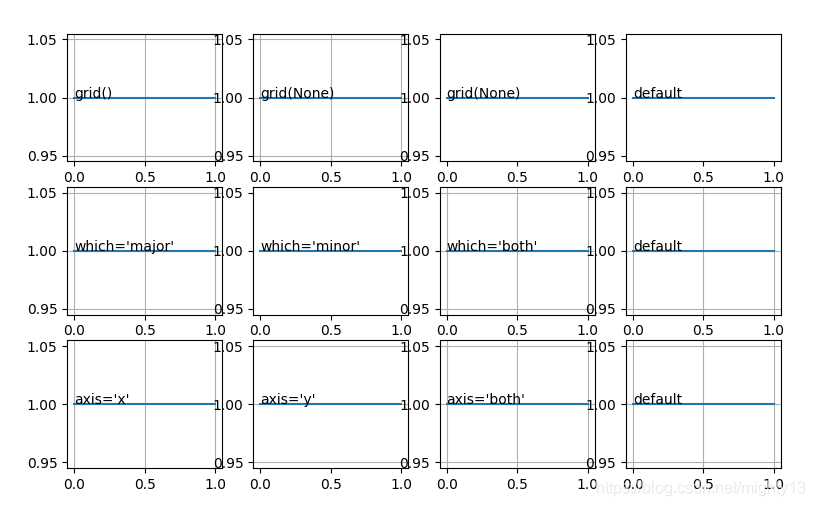
1 2 3 4 5 6 7 8 9 10 11 12 13 14 15 16 17 18 19 20 21 22 23 24 25 26 27 28 29 30 31 32 33 34 35 36 37 38 39 40 41 42 43 44 45 46 47 48 49 50 51 52 53 54 55 56 57 58 59 60 61 62 63 | import matplotlib.pyplot as pltplt.subplot(341)# grid()默认样式plt.plot([1, 1])plt.grid()plt.annotate('grid()', (0, 1))plt.subplot(342)# 因为默认没有网格线,所以grid(None)显示网格线plt.plot([1, 1])plt.grid(None)plt.annotate('grid(None)', (0, 1))plt.subplot(343)# 因为设置了网格线,所以grid(None)切换为不显示网格线plt.plot([1, 1])plt.grid(True)plt.grid(None)plt.annotate('grid(None)', (0, 1))plt.subplot(344)# 因为默认没有网格线plt.plot([1, 1])plt.annotate("default", (0, 1))plt.subplot(345)# 只显示主刻度网格线plt.plot([1, 1])plt.grid(which='major')plt.annotate("which='major'", (0, 1))plt.subplot(346)# 只显示次刻度网格线,因为没有次刻度,所以无网格线plt.plot([1, 1])plt.grid(which='minor')plt.annotate("which='minor'", (0, 1))plt.subplot(347)# 同时显示主刻度、次刻度网格线plt.plot([1, 1])plt.grid(which='both')plt.annotate("which='both'", (0, 1))plt.subplot(348)plt.plot([1, 1])# 默认同时显示主刻度、次刻度网格线plt.grid()plt.annotate("default", (0, 1))plt.subplot(349)# 只显示x轴网格线plt.plot([1, 1])plt.grid(axis='x')plt.annotate("axis='x'", (0, 1))plt.subplot(3,4,10)# 只显示y轴网格线plt.plot([1, 1])plt.grid(axis='y')plt.annotate("axis='y'", (0, 1))plt.subplot(3,4,11)# 同时显示xy轴网格线plt.plot([1, 1])plt.grid(axis='both')plt.annotate("axis='both'", (0, 1))plt.subplot(3,4,12)# 默认显示xy轴网格线plt.plot([1, 1])plt.grid()plt.annotate("default", (0, 1))plt.show() |
原理
pyplot.grid()其实调用的是gca().grid(),即Aexs.grid()。
底层相关函数有:Axis.grid()
Axes.grid()源码(matplotlib/Axes/_base.py)
1 2 3 4 5 6 | def grid(self, b=None, which='major', axis='both', **kwargs): cbook._check_in_list(['x', 'y', 'both'], axis=axis) if axis in ['x', 'both']: self.xaxis.grid(b, which=which, **kwargs) if axis in ['y', 'both']: self.yaxis.grid(b, which=which, **kwargs) |
xaxis 为XAxis类的实例,yaxis为YAxis类的实例,XAxis和YAxis类的基类为Axis。
Axis.grid()源码(matplotlib/axis.py)
1 2 3 4 5 6 7 8 9 10 11 12 13 14 15 16 17 18 19 20 21 22 23 24 25 26 27 28 29 30 31 32 | def grid(self, b=None, which='major', **kwargs): if b is not None: if 'visible' in kwargs and bool(b) != bool(kwargs['visible']): raise ValueError( "'b' and 'visible' specify inconsistent grid visibilities") if kwargs and not b: # something false-like but not None cbook._warn_external('First parameter to grid() is false, ' 'but line properties are supplied. The ' 'grid will be enabled.') b = True which = which.lower() cbook._check_in_list(['major', 'minor', 'both'], which=which) gridkw = {'grid_' + item[0]: item[1] for item in kwargs.items()} if 'grid_visible' in gridkw: forced_visibility = True gridkw['gridOn'] = gridkw.pop('grid_visible') else: forced_visibility = False if which in ['minor', 'both']: if b is None and not forced_visibility: gridkw['gridOn'] = not self._minor_tick_kw['gridOn'] elif b is not None: gridkw['gridOn'] = b self.set_tick_params(which='minor', **gridkw) if which in ['major', 'both']: if b is None and not forced_visibility: gridkw['gridOn'] = not self._major_tick_kw['gridOn'] elif b is not None: gridkw['gridOn'] = b self.set_tick_params(which='major', **gridkw) self.stale = True |
到此这篇关于matplotlib grid()设置网格线外观的实现的文章就介绍到这了