
matplotlib bar()实现百分比堆积柱状图
这篇文章主要介绍了matplotlib bar()实现百分比堆积柱状图,文中通过示例代码介绍的非常详细,对大家的学习或者工作具有一定的参考学习价值,需要的朋友们下面随着小编来一起学习学习吧
使用matplotlib创建百分比堆积柱状图的思路与堆积柱状图类似,只不过bottom参数累计的不是数值而是百分比,因此,需要事先计算每组柱子的数值总和,进而求百分比。
未使用numpy版本
适用于少量数据,数据结构需要手动构造。
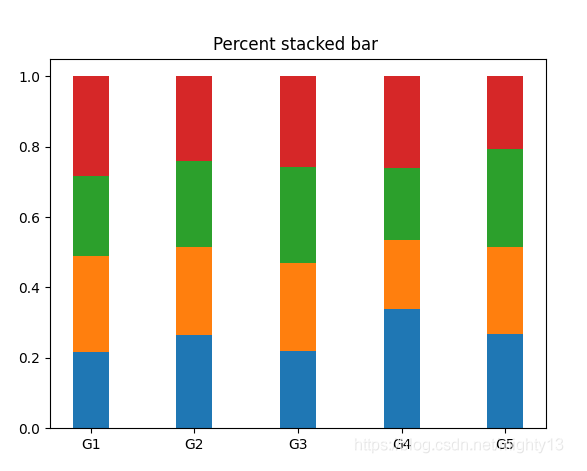
1 2 3 4 5 6 7 8 9 10 11 12 13 14 15 16 17 18 19 20 21 22 23 24 25 26 | import matplotlib.pyplot as pltlabels = ['G1', 'G2', 'G3', 'G4', 'G5']first = [20, 34, 30, 35, 27]second = [25, 32, 34, 20, 25]third = [21, 31, 37, 21, 28]fourth = [26, 31, 35, 27, 21]data = [first, second, third, fourth]x = range(len(labels))width = 0.35# 将bottom_y元素都初始化为0bottom_y = [0] * len(labels)# 计算每组柱子的总和,为计算百分比做准备sums = [sum(i) for i in zip(first, second, third, fourth)]for i in data: # 计算每个柱子的高度,即百分比 y = [a/b for a, b in zip(i, sums)] plt.bar(x, y, width, bottom=bottom_y) # 计算bottom参数的位置 bottom_y = [(a+b) for a, b in zip(y, bottom_y)]plt.xticks(x, labels)plt.title('Percent stacked bar ')plt.show() |
使用numpy版本
第一个版本的缺陷在于数据需要手动构造,而且计算稍微繁琐一些。
使用numpy便于处理规模比较大且已存储在文件中数据的数据,计算更简便。
1 2 3 4 5 6 7 8 9 10 11 12 13 14 15 16 17 18 19 20 21 22 23 24 25 26 27 28 | import numpy as npimport matplotlib.pyplot as pltlabels = ['G1', 'G2', 'G3', 'G4', 'G5']first = [20, 34, 30, 35, 27]second = [25, 32, 34, 20, 25]third = [21, 31, 37, 21, 28]fourth = [26, 31, 35, 27, 21]data = [first, second, third, fourth]x = range(len(labels))width = 0.35# 将bottom_y元素都初始化为0bottom_y = np.zeros(len(labels))data = np.array(data)# 按列计算计算每组柱子的总和,为计算百分比做准备sums = np.sum(data, axis=0)for i in data: # 计算每个柱子的高度,即百分比 y = i / sums plt.bar(x, y, width, bottom=bottom_y) # 计算bottom参数的位置 bottom_y = y + bottom_yplt.xticks(x, labels)plt.title('Percent stacked bar ')plt.show() |
到此这篇关于matplotlib bar()实现百分比堆积柱状图 的文章就介绍到这了,