
matplotlib之多边形选区(PolygonSelector)的使用
这篇文章主要介绍了matplotlib之多边形选区(PolygonSelector)的使用,文中通过示例代码介绍的非常详细,对大家的学习或者工作具有一定的参考学习价值,需要的朋友们下面随着小编来一起学习学习吧
多边形选区概述
多边形选区是一种常见的对象选择方式,在一个子图中,单击鼠标左键即构建一个多边形的端点,最后一个端点与第一个端点重合即完成多边形选区,选区即为多个端点构成的多边形。在matplotlib中的多边形选区属于部件(widgets),matplotlib中的部件都是中性(neutral )的,即与具体后端实现无关。
多边形选区具体实现定义为matplotlib.widgets.PolygonSelector类,继承关系为:Widget->AxesWidget->_SelectorWidget->PolygonSelector。
PolygonSelector类的签名为class matplotlib.widgets.PolygonSelector(ax, onselect, useblit=False, lineprops=None, markerprops=None, vertex_select_radius=15)
PolygonSelector类构造函数的参数为:
ax:多边形选区生效的子图,类型为matplotlib.axes.Axes的实例。
onselect:多边形选区完成后执行的回调函数,函数签名为def onselect( vertices),vertices数据类型为列表,列表元素格式为(xdata,ydata)元组。
drawtype:多边形选区的外观,取值范围为{"box", "line", "none"},"box"为多边形框,"line"为多边形选区对角线,"none"无外观,类型为字符串,默认值为"box"。
lineprops:多边形选区线条的属性,默认值为dict(color='k', linestyle='-', linewidth=2, alpha=0.5)。
markerprops:多边形选区端点的属性,默认值为dict(marker='o', markersize=7, mec='k', mfc='k', alpha=0.5)。
vertex_select_radius:多边形端点的选择半径,浮点数,默认值为15,用于端点选择或者多边形闭合。
PolygonSelector类中的state_modifier_keys公有变量 state_modifier_keys定义了操作快捷键,类型为字典。
“move_all”: 移动已存在的选区,默认为"shift"。
“clear”:清除现有选区,默认为 "escape",即esc键。
“move_vertex”:正方形选区,默认为"control"。
PolygonSelector类中的verts特性返回多边形选区中的多有端点,类型为列表,元素为(x,y)元组,即端点的坐标元组。
案例
官方案例,https://matplotlib.org/gallery/widgets/polygon_selector_demo.html
案例说明
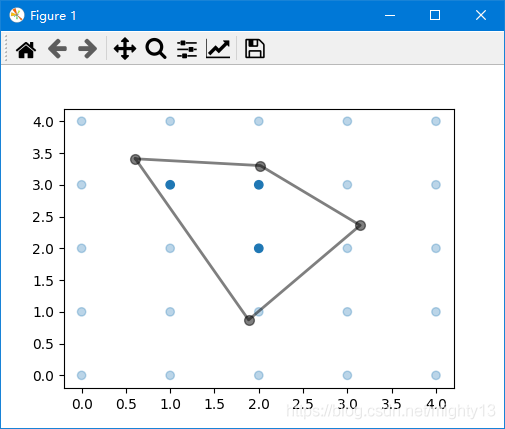
单击鼠标左键创建端点,最终点击初始端点闭合多边形,形成多边形选区。选区外的数据元素颜色变淡,选区内数据颜色保持不变。
按esc键取消选区。按shift键鼠标可以移动多边形选区位置,按ctrl键鼠标可以移动多边形选区某个端点的位置。退出程序时,控制台输出选区内数据元素的坐标。
控制台输出:
Selected points:
[[2.0 2.0]
[1.0 3.0]
[2.0 3.0]]
案例代码
1 2 3 4 5 6 7 8 9 10 11 12 13 14 15 16 17 18 19 20 21 22 23 24 25 26 27 28 29 30 31 32 33 34 35 36 37 38 39 40 41 42 43 44 45 46 47 48 49 50 51 52 53 54 55 56 57 58 59 60 61 62 63 64 65 66 67 68 69 70 71 72 73 74 75 76 77 78 79 80 81 82 83 84 85 | import numpy as npfrom matplotlib.widgets import PolygonSelectorfrom matplotlib.path import Pathclass SelectFromCollection: """ Select indices from a matplotlib collection using `PolygonSelector`. Selected indices are saved in the `ind` attribute. This tool fades out the points that are not part of the selection (i.e., reduces their alpha values). If your collection has alpha < 1, this tool will permanently alter the alpha values. Note that this tool selects collection objects based on their *origins* (i.e., `offsets`). Parameters ---------- ax : `~matplotlib.axes.Axes` Axes to interact with. collection : `matplotlib.collections.Collection` subclass Collection you want to select from. alpha_other : 0 <= float <= 1 To highlight a selection, this tool sets all selected points to an alpha value of 1 and non-selected points to *alpha_other*. """ def __init__(self, ax, collection, alpha_other=0.3): self.canvas = ax.figure.canvas self.collection = collection self.alpha_other = alpha_other self.xys = collection.get_offsets() self.Npts = len(self.xys) # Ensure that we have separate colors for each object self.fc = collection.get_facecolors() if len(self.fc) == 0: raise ValueError('Collection must have a facecolor') elif len(self.fc) == 1: self.fc = np.tile(self.fc, (self.Npts, 1)) self.poly = PolygonSelector(ax, self.onselect) self.ind = [] def onselect(self, verts): path = Path(verts) self.ind = np.nonzero(path.contains_points(self.xys))[0] self.fc[:, -1] = self.alpha_other self.fc[self.ind, -1] = 1 self.collection.set_facecolors(self.fc) self.canvas.draw_idle() def disconnect(self): self.poly.disconnect_events() self.fc[:, -1] = 1 self.collection.set_facecolors(self.fc) self.canvas.draw_idle()if __name__ == '__main__': import matplotlib.pyplot as plt fig, ax = plt.subplots() grid_size = 5 grid_x = np.tile(np.arange(grid_size), grid_size) grid_y = np.repeat(np.arange(grid_size), grid_size) pts = ax.scatter(grid_x, grid_y) selector = SelectFromCollection(ax, pts) print("Select points in the figure by enclosing them within a polygon.") print("Press the 'esc' key to start a new polygon.") print("Try holding the 'shift' key to move all of the vertices.") print("Try holding the 'ctrl' key to move a single vertex.") plt.show() selector.disconnect() # After figure is closed print the coordinates of the selected points print('\nSelected points:') print(selector.xys[selector.ind]) |
到此这篇关于matplotlib之多边形选区(PolygonSelector)的使用的文章就介绍到这了