
matplotlib阶梯图的实现(step())
这篇文章主要介绍了matplotlib阶梯图的实现(step()),文中通过示例代码介绍的非常详细,对大家的学习或者工作具有一定的参考学习价值,需要的朋友们下面随着小编来一起学习学习吧
step函数概述
step函数用于绘制阶梯图。
根据源码可知,step函数是对plot函数的轻量级封装,很多概念和用法与plot函数非常相似。
1 2 3 4 | def step(self, x, y, *args, where='pre', data=None, **kwargs): cbook._check_in_list(('pre', 'post', 'mid'), where=where) kwargs['drawstyle'] = 'steps-' + where return self.plot(x, y, *args, data=data, **kwargs) |
step函数签名:
1 | matplotlib.pyplot.step(x, y, *args, where='pre', data=None, **kwargs) |
step函数调用签名:
1 2 | step(x, y, [fmt], *, data=None, where='pre', **kwargs)step(x, y, [fmt], x2, y2, [fmt2], ..., *, where='pre', **kwargs) |
其中:
x:类数组结构,一维x轴坐标序列。一般假设x轴坐标均匀递增。必备参数。
y:类数组结构,一维y轴坐标序列。必备参数。
fmt:格式字符串,与plot函数的fmt参数类似。可选参数。官方建议只设置颜色格式。
data:可索引数据,类似于plot函数。可选参数。
**kwargs:类似于plot函数。
where :设置阶梯所在位置,取值范围为{'pre', 'post', 'mid'},默认值为'pre'。
案例:使用step函数和plot函数演示不同where参数的效果
通过案例可知,step函数可以认为是plot函数绘制阶梯图的一个特例。
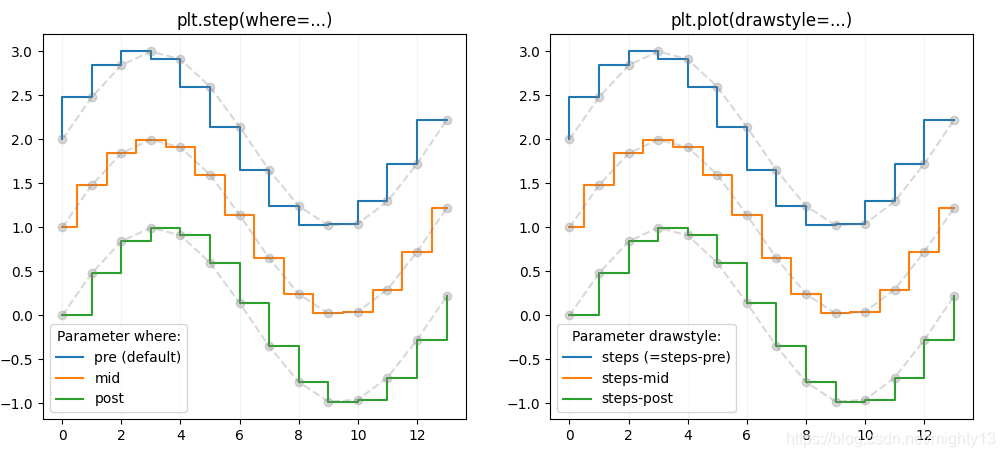
1 2 3 4 5 6 7 8 9 10 11 12 13 14 15 16 17 18 19 20 21 22 23 24 25 26 27 28 29 30 31 32 33 34 35 | import numpy as npimport matplotlib.pyplot as pltx = np.arange(14)y = np.sin(x / 2)plt.figure(figsize=(12,5))plt.subplot(121)plt.step(x, y + 2, label='pre (default)')plt.plot(x, y + 2, 'o--', color='grey', alpha=0.3)plt.step(x, y + 1, where='mid', label='mid')plt.plot(x, y + 1, 'o--', color='grey', alpha=0.3)plt.step(x, y, where='post', label='post')plt.plot(x, y, 'o--', color='grey', alpha=0.3)plt.grid(axis='x', color='0.95')plt.legend(title='Parameter where:')plt.title('plt.step(where=...)')plt.subplot(122)plt.plot(x, y + 2, drawstyle='steps', label='steps (=steps-pre)')plt.plot(x, y + 2, 'o--', color='grey', alpha=0.3)plt.plot(x, y + 1, drawstyle='steps-mid', label='steps-mid')plt.plot(x, y + 1, 'o--', color='grey', alpha=0.3)plt.plot(x, y, drawstyle='steps-post', label='steps-post')plt.plot(x, y, 'o--', color='grey', alpha=0.3)plt.grid(axis='x', color='0.95')plt.legend(title='Parameter drawstyle:')plt.title('plt.plot(drawstyle=...)')plt.show() |
到此这篇关于matplotlib阶梯图的实现(step())的文章就介绍到这了