
面试官问我:如何使用LeakCanary排查Android中的内存泄露,看我如何用漫画装逼!
在项目的build.gradle文件添加:
debugCompile 'com.squareup.leakcanary:leakcanary-android:1.5' releaseCompile 'com.squareup.leakcanary:leakcanary-android-no-op:1.5' testCompile 'com.squareup.leakcanary:leakcanary-android-no-op:1.5' 复制代码
可以看到,debugCompile跟releaseCompile 引入的是不同的包, 在 debug 版本上,集成 LeakCanary 库,并执行内存泄漏监测,而在 release 版本上,集成一个无操作的 wrapper ,这样对程序性能就不会有影响。
2)在Application类添加:
public class LCApplication extends Application { @Override public void onCreate() { super.onCreate(); if (LeakCanary.isInAnalyzerProcess(this)) { // This process is dedicated to LeakCanary for heap analysis. // You should not init your app in this process. return; } LeakCanary.install(this); // Normal app init code... } } 复制代码LeakCanary.install() 会返回一个预定义的 RefWatcher,同时也会启用一个 ActivityRefWatcher,用于自动监控调用 Activity.onDestroy() 之后泄露的 activity。
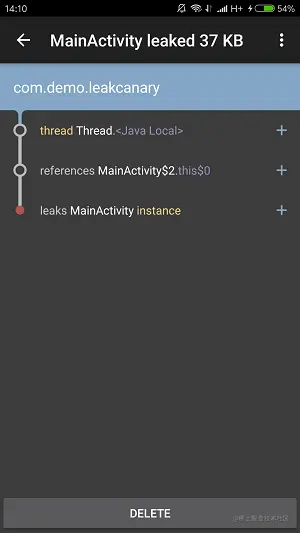
如果是简单的检测activity是否存在内存泄漏,上面两个步骤就可以了,是不是很简单。 那么当某个activity存在内存泄漏的时候,会有什么提示呢?LeakCanary会自动展示一个通知栏,点开提示框你会看到引起内存溢出的引用堆栈信息。
 具体使用代码
1)Application 相关代码:
public class LCApplication extends Application { @Override public void onCreate() { super.onCreate(); if (LeakCanary.isInAnalyzerProcess(this)) { // This process is dedicated to LeakCanary for heap analysis. // You should not init your app in this process. return; } LeakCanary.install(this); // Normal app init code... } } 复制代码2)泄漏的activity类代码:
public class MainActivity extends Activity { private Button next; @Override protected void onCreate(Bundle savedInstanceState) { super.onCreate(savedInstanceState); setContentView(R.layout.activity_main); next = (Button) findViewById(R.id.next); next.setOnClickListener(new View.OnClickListener() { @Override public void onClick(View v) { Intent intent = new Intent(MainActivity.this, SecondActivity.class); startActivity(intent); finish(); } }); new Thread(new Runnable() { @Override public void run() { while (true) { System.out.println("================="); } } }).start(); } } 复制代码当点击next跳到第二个界面后,LeakCanary会自动展示一个通知栏,点开提示框你会看到引起内存溢出的引用堆栈信息,如上图所示,这样你就很容易定位到原来是线程引用住当前activity,导致activity无法释放。
上面提到,LeakCanary.install() 会返回一个预定义的 RefWatcher,同时也会启用一个 ActivityRefWatcher,用于自动监控调用 Activity.onDestroy() 之后泄露的 activity。现在很多app都使用到了fragment,那fragment如何检测呢。
1)Application 中获取到refWatcher对象。
public class LCApplication extends Application { public static RefWatcher refWatcher; @Override public void onCreate() { super.onCreate(); if (LeakCanary.isInAnalyzerProcess(this)) { // This process is dedicated to LeakCanary for heap analysis. // You should not init your app in this process. return; } refWatcher = LeakCanary.install(this); // Normal app init code... } } 复制代码2)使用 RefWatcher 监控 Fragment:
public abstract class BaseFragment extends Fragment { @Override public void onDestroy() { super.onDestroy(); RefWatcher refWatcher = LCApplication.refWatcher; refWatcher.watch(this); } } 复制代码这样则像监听activity一样监听fragment。其实这种方式一样适用于任何对象,比如图片,自定义类等等,非常方便。
LeakCanary.install(this)源码如下所示:
public static RefWatcher install(Application application) { return ((AndroidRefWatcherBuilder)refWatcher(application).listenerServiceClass(DisplayLeakService.class).excludedRefs(AndroidExcludedRefs.createAppDefaults().build())).buildAndInstall(); } 复制代码listenerServiceClass(DisplayLeakService.class):用于分析内存泄漏结果信息,然后发送通知给用户。 excludedRefs(AndroidExcludedRefs.createAppDefaults().build()):设置需要忽略的对象,比如某些系统漏洞不需要统计。 buildAndInstall():真正检测内存泄漏的方法,下面将展开分析该方法。
public RefWatcher buildAndInstall() { RefWatcher refWatcher = this.build(); if(refWatcher != RefWatcher.DISABLED) { LeakCanary.enableDisplayLeakActivity(this.context); ActivityRefWatcher.installOnIcsPlus((Application)this.context, refWatcher); } return refWatcher; } 复制代码可以看到,上面方法主要做了三件事情: 1.实例化RefWatcher对象,该对象主要作用是检测是否有对象未被回收导致内存泄漏; 2.设置APP图标可见; 3.检测内存
RefWatcher的使用后面讲,这边主要看第二件事情的处理过程,及enableDisplayLeakActivity方法的源码
public static void enableDisplayLeakActivity(Context context) { LeakCanaryInternals.setEnabled(context, DisplayLeakActivity.class, true); } 复制代码public static void setEnabled(Context context, final Class<?> componentClass, final boolean enabled) { final Context appContext = context.getApplicationContext(); executeOnFileIoThread(new Runnable() { public void run() { LeakCanaryInternals.setEnabledBlocking(appContext, componentClass, enabled); } }); } 复制代码public static void setEnabledBlocking(Context appContext, Class<?> componentClass, boolean enabled) { ComponentName component = new ComponentName(appContext, componentClass); PackageManager packageManager = appContext.getPackageManager(); int newState = enabled?1:2; packageManager.setComponentEnabledSetting(component, newState, 1); } 复制代码可见,最后调用packageManager.setComponentEnabledSetting()方法,实现应用图标的隐藏和显示。
接下来,进入真正的内存检查的方法installOnIcsPlus()
public static void installOnIcsPlus(Application application, RefWatcher refWatcher) { if(VERSION.SDK_INT >= 14) { ActivityRefWatcher activityRefWatcher = new ActivityRefWatcher(application, refWatcher); activityRefWatcher.watchActivities(); } } 复制代码该方法实例化出ActivityRefWatcher 对象,该对象用来监听activity的生命周期,具体实现如下所示:
public void watchActivities() { this.stopWatchingActivities(); this.application.registerActivityLifecycleCallbacks(this.lifecycleCallbacks); } 复制代码private final ActivityLifecycleCallbacks lifecycleCallbacks = new ActivityLifecycleCallbacks() { public void onActivityCreated(Activity activity, Bundle savedInstanceState) { } public void onActivityStarted(Activity activity) { } public void onActivityResumed(Activity activity) { } public void onActivityPaused(Activity activity) { } public void onActivityStopped(Activity activity) { } public void onActivitySaveInstanceState(Activity activity, Bundle outState) { } public void onActivityDestroyed(Activity activity) { ActivityRefWatcher.this.onActivityDestroyed(activity); } }; 复制代码调用了registerActivityLifecycleCallbacks方法后,当Activity执行onDestroy方法后,会触发ActivityLifecycleCallbacks 的onActivityDestroyed方法,在当前方法中,调用refWatcher的watch方法,前面已经讲过RefWatcher对象主要作用是检测是否有对象未被回收导致内存泄漏。下面继续看refWatcher的watch方法源码:
public void watch(Object watchedReference) { this.watch(watchedReference, ""); } public void watch(Object watchedReference, String referenceName) { if(this != DISABLED) { Preconditions.checkNotNull(watchedReference, "watchedReference"); Preconditions.checkNotNull(referenceName, "referenceName"); long watchStartNanoTime = System.nanoTime(); String key = UUID.randomUUID().toString(); this.retainedKeys.add(key); KeyedWeakReference reference = new KeyedWeakReference(watchedReference, key, referenceName, this.queue); this.ensureGoneAsync(watchStartNanoTime, reference); } } 复制代码可以看到,上面方法主要做了三件事情: 1.生成一个随机数key存放在retainedKeys集合中,用来判断对象是否被回收; 2.把当前Activity放到KeyedWeakReference(WeakReference的子类)中; 3.通过查找ReferenceQueue,看该Acitivity是否存在,存在则证明可以被正常回收,不存在则证明可能存在内存泄漏。 前两件事很简单,这边主要看第三件事情的处理过程,及ensureGoneAsync方法的源码:
private void ensureGoneAsync(final long watchStartNanoTime, final KeyedWeakReference reference) { this.watchExecutor.execute(new Retryable() { public Result run() { return RefWatcher.this.ensureGone(reference, watchStartNanoTime); } }); } Result ensureGone(KeyedWeakReference reference, long watchStartNanoTime) { long gcStartNanoTime = System.nanoTime(); long watchDurationMs = TimeUnit.NANOSECONDS.toMillis(gcStartNanoTime - watchStartNanoTime); this.removeWeaklyReachableReferences(); if(this.debuggerControl.isDebuggerAttached()) { return Result.RETRY; } else if(this.gone(reference)) { return Result.DONE; } else { this.gcTrigger.runGc(); this.removeWeaklyReachableReferences(); if(!this.gone(reference)) { long startDumpHeap = System.nanoTime(); long gcDurationMs = TimeUnit.NANOSECONDS.toMillis(startDumpHeap - gcStartNanoTime); File heapDumpFile = this.heapDumper.dumpHeap(); if(heapDumpFile == HeapDumper.RETRY_LATER) { return Result.RETRY; } long heapDumpDurationMs = TimeUnit.NANOSECONDS.toMillis(System.nanoTime() - startDumpHeap); this.heapdumpListener.analyze(new HeapDump(heapDumpFile, reference.key, reference.name, this.excludedRefs, watchDurationMs, gcDurationMs, heapDumpDurationMs)); } return Result.DONE; } } 复制代码该方法中首先执行removeWeaklyReachableReferences(),从ReferenceQueue队列中查询是否存在该弱引用对象,如果不为空,则说明已经被系统回收了,则将对应的随机数key从retainedKeys集合中删除。
private void removeWeaklyReachableReferences() { KeyedWeakReference ref; while((ref = (KeyedWeakReference)this.queue.poll()) != null) { this.retainedKeys.remove(ref.key); } } 复制代码然后通过判断retainedKeys集合中是否存在对应的key判断该对象是否被回收。
private boolean gone(KeyedWeakReference reference) { return !this.retainedKeys.contains(reference.key); } 复制代码如果没有被系统回收,则手动调用gcTrigger.runGc();后再调用removeWeaklyReachableReferences方法判断该对象是否被回收。
GcTrigger DEFAULT = new GcTrigger() { public void runGc() { Runtime.getRuntime().gc(); this.enqueueReferences(); System.runFinalization(); } private void enqueueReferences() { try { Thread.sleep(100L); } catch (InterruptedException var2) { throw new AssertionError(); } } }; 复制代码第三行代码为手动触发GC,紧接着线程睡100毫秒,给系统回收的时间,随后通过System.runFinalization()手动调用已经失去引用对象的finalize方法。 通过手动GC该对象还不能被回收的话,则存在内存泄漏,调用heapDumper.dumpHeap()生成.hprof文件目录,并通过heapdumpListener回调到analyze()方法,后面关于dump文件的分析这边就不介绍了,感兴趣的可以自行去看。
作者:天才少年_
链接:https://juejin.cn/post/6844904165265670157